An AI business analyst on your team, around the clock.
It watches the metrics that run your business, investigates what moved and why, and turns it into the dashboards and reports you need — with its work shown.
No credit card · Connect Postgres or upload a CSV in minutes.
Workspace
Setup
Reactivation campaigns on Social and Affiliate drove the strongest returns last quarter — high ROI on modest spend.
It does the analyst’s job — and shows its work
It doesn't just answer questions — it does the analysis, end to end, and shows you every step.
Ask in plain English. Get a live dashboard.
Describe what you want. Boardku builds a live dashboard — no drag-and-drop, no analyst queue, no waiting on a report.
- From question to charted answer in one prompt
- Always live — it re-queries your source, not a snapshot
- Follow up in words to drill deeper
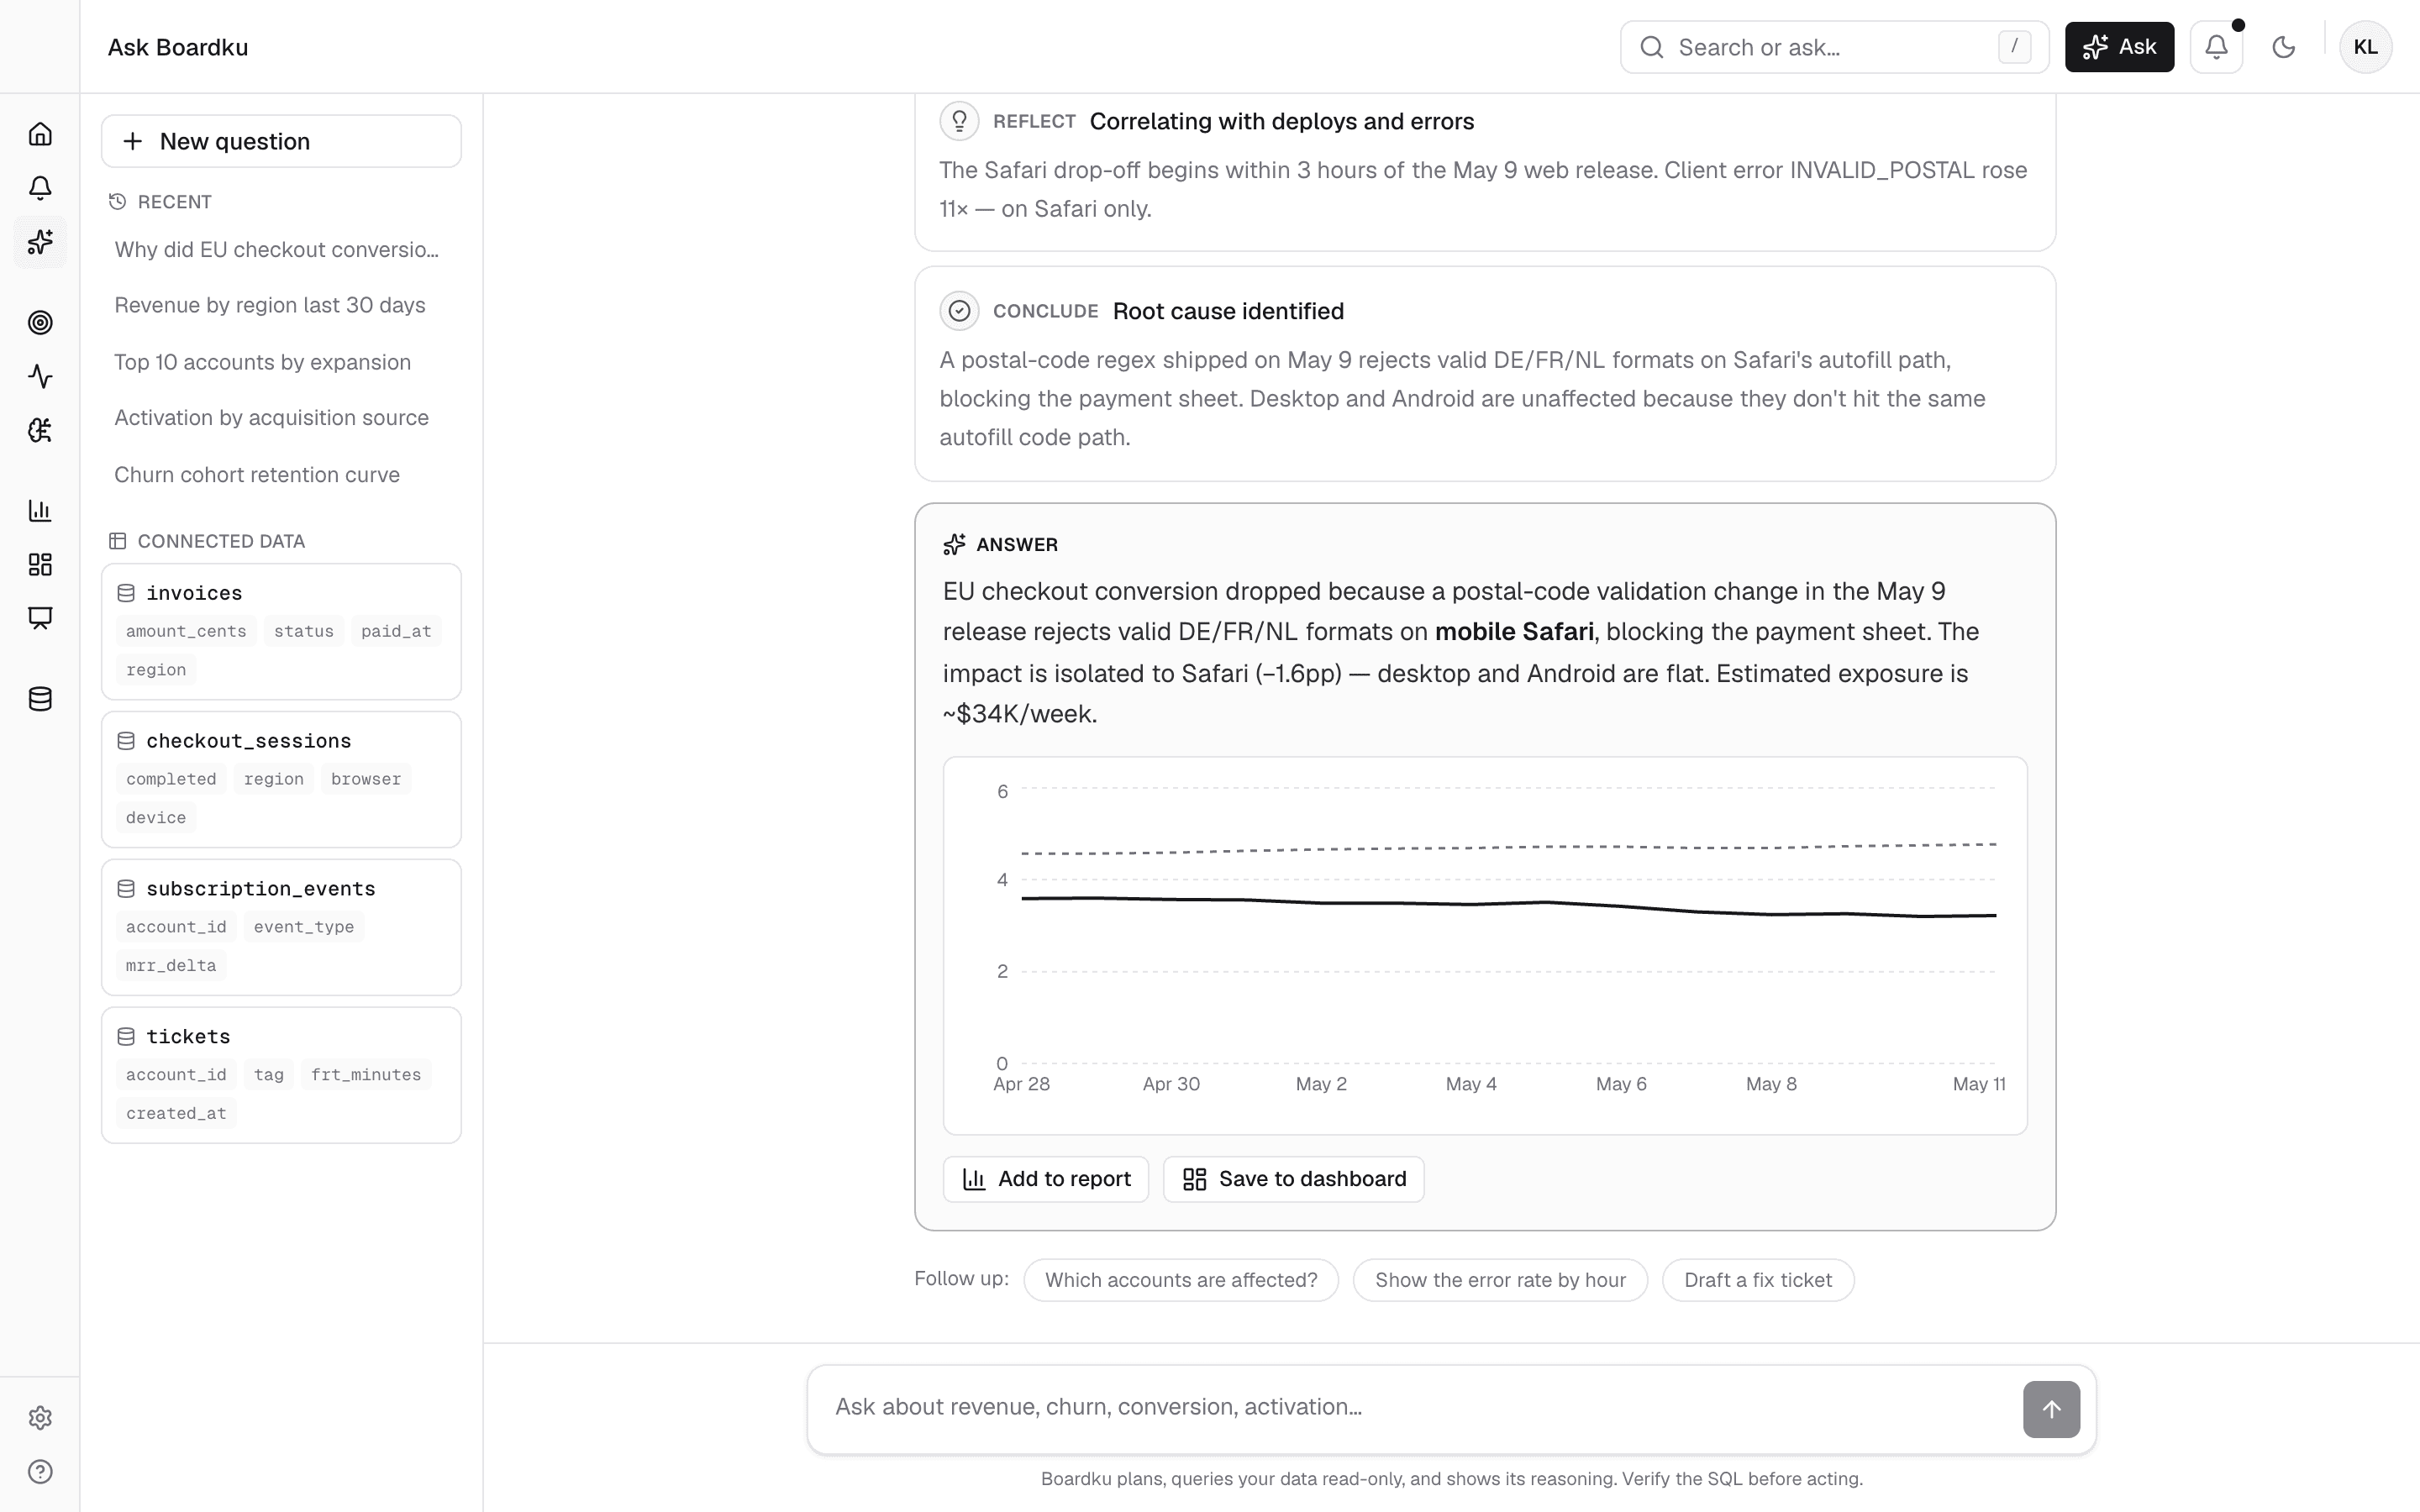
It writes the SQL — and shows you every line.
Ask in words. Boardku writes and fixes the query, showing every change as a diff so you can trust the number behind the chart.
- Generated SQL you can read, edit, and run
- Every fix shown as an inline diff
- No black box — the reasoning is on the table
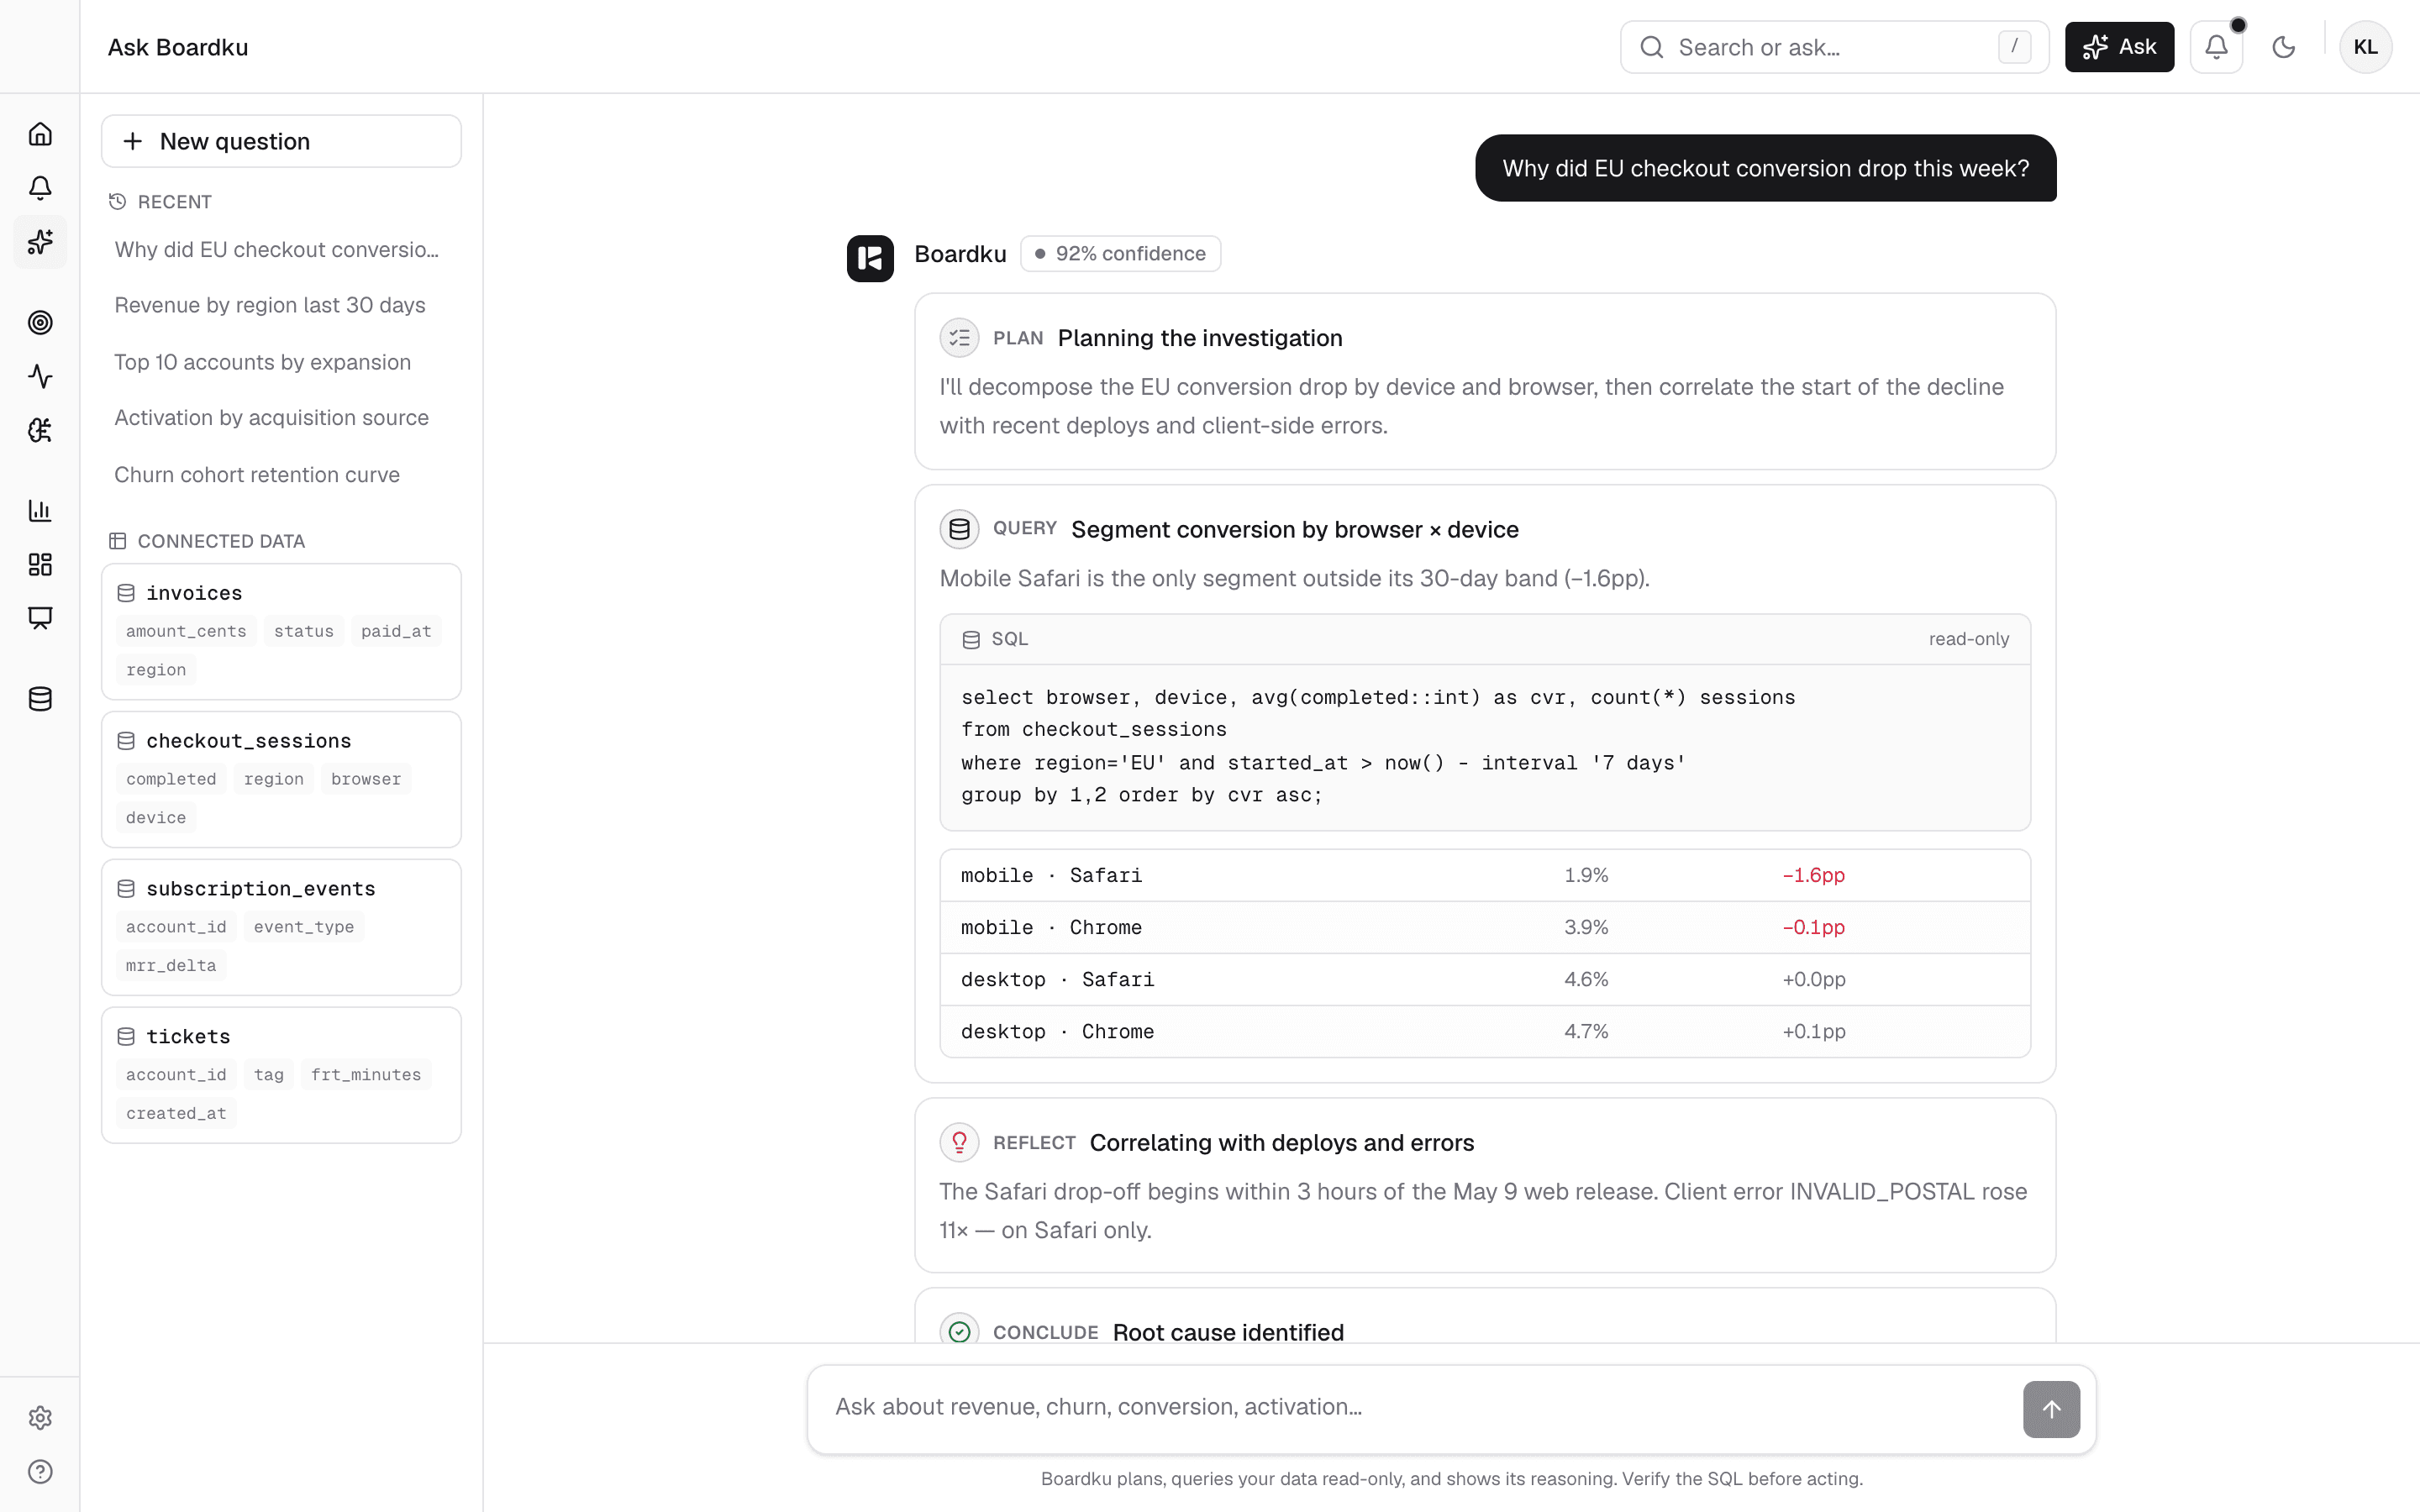
Plug in your data. It learns your schema.
Start with CSVs and the core business systems in your stack. Boardku keeps source context, schema notes, and business terms close to every answer.
- Databases, warehouses, billing data, and CSVs
- Schema notes and joins kept with the workspace
- Read-only by default — it informs, never writes back
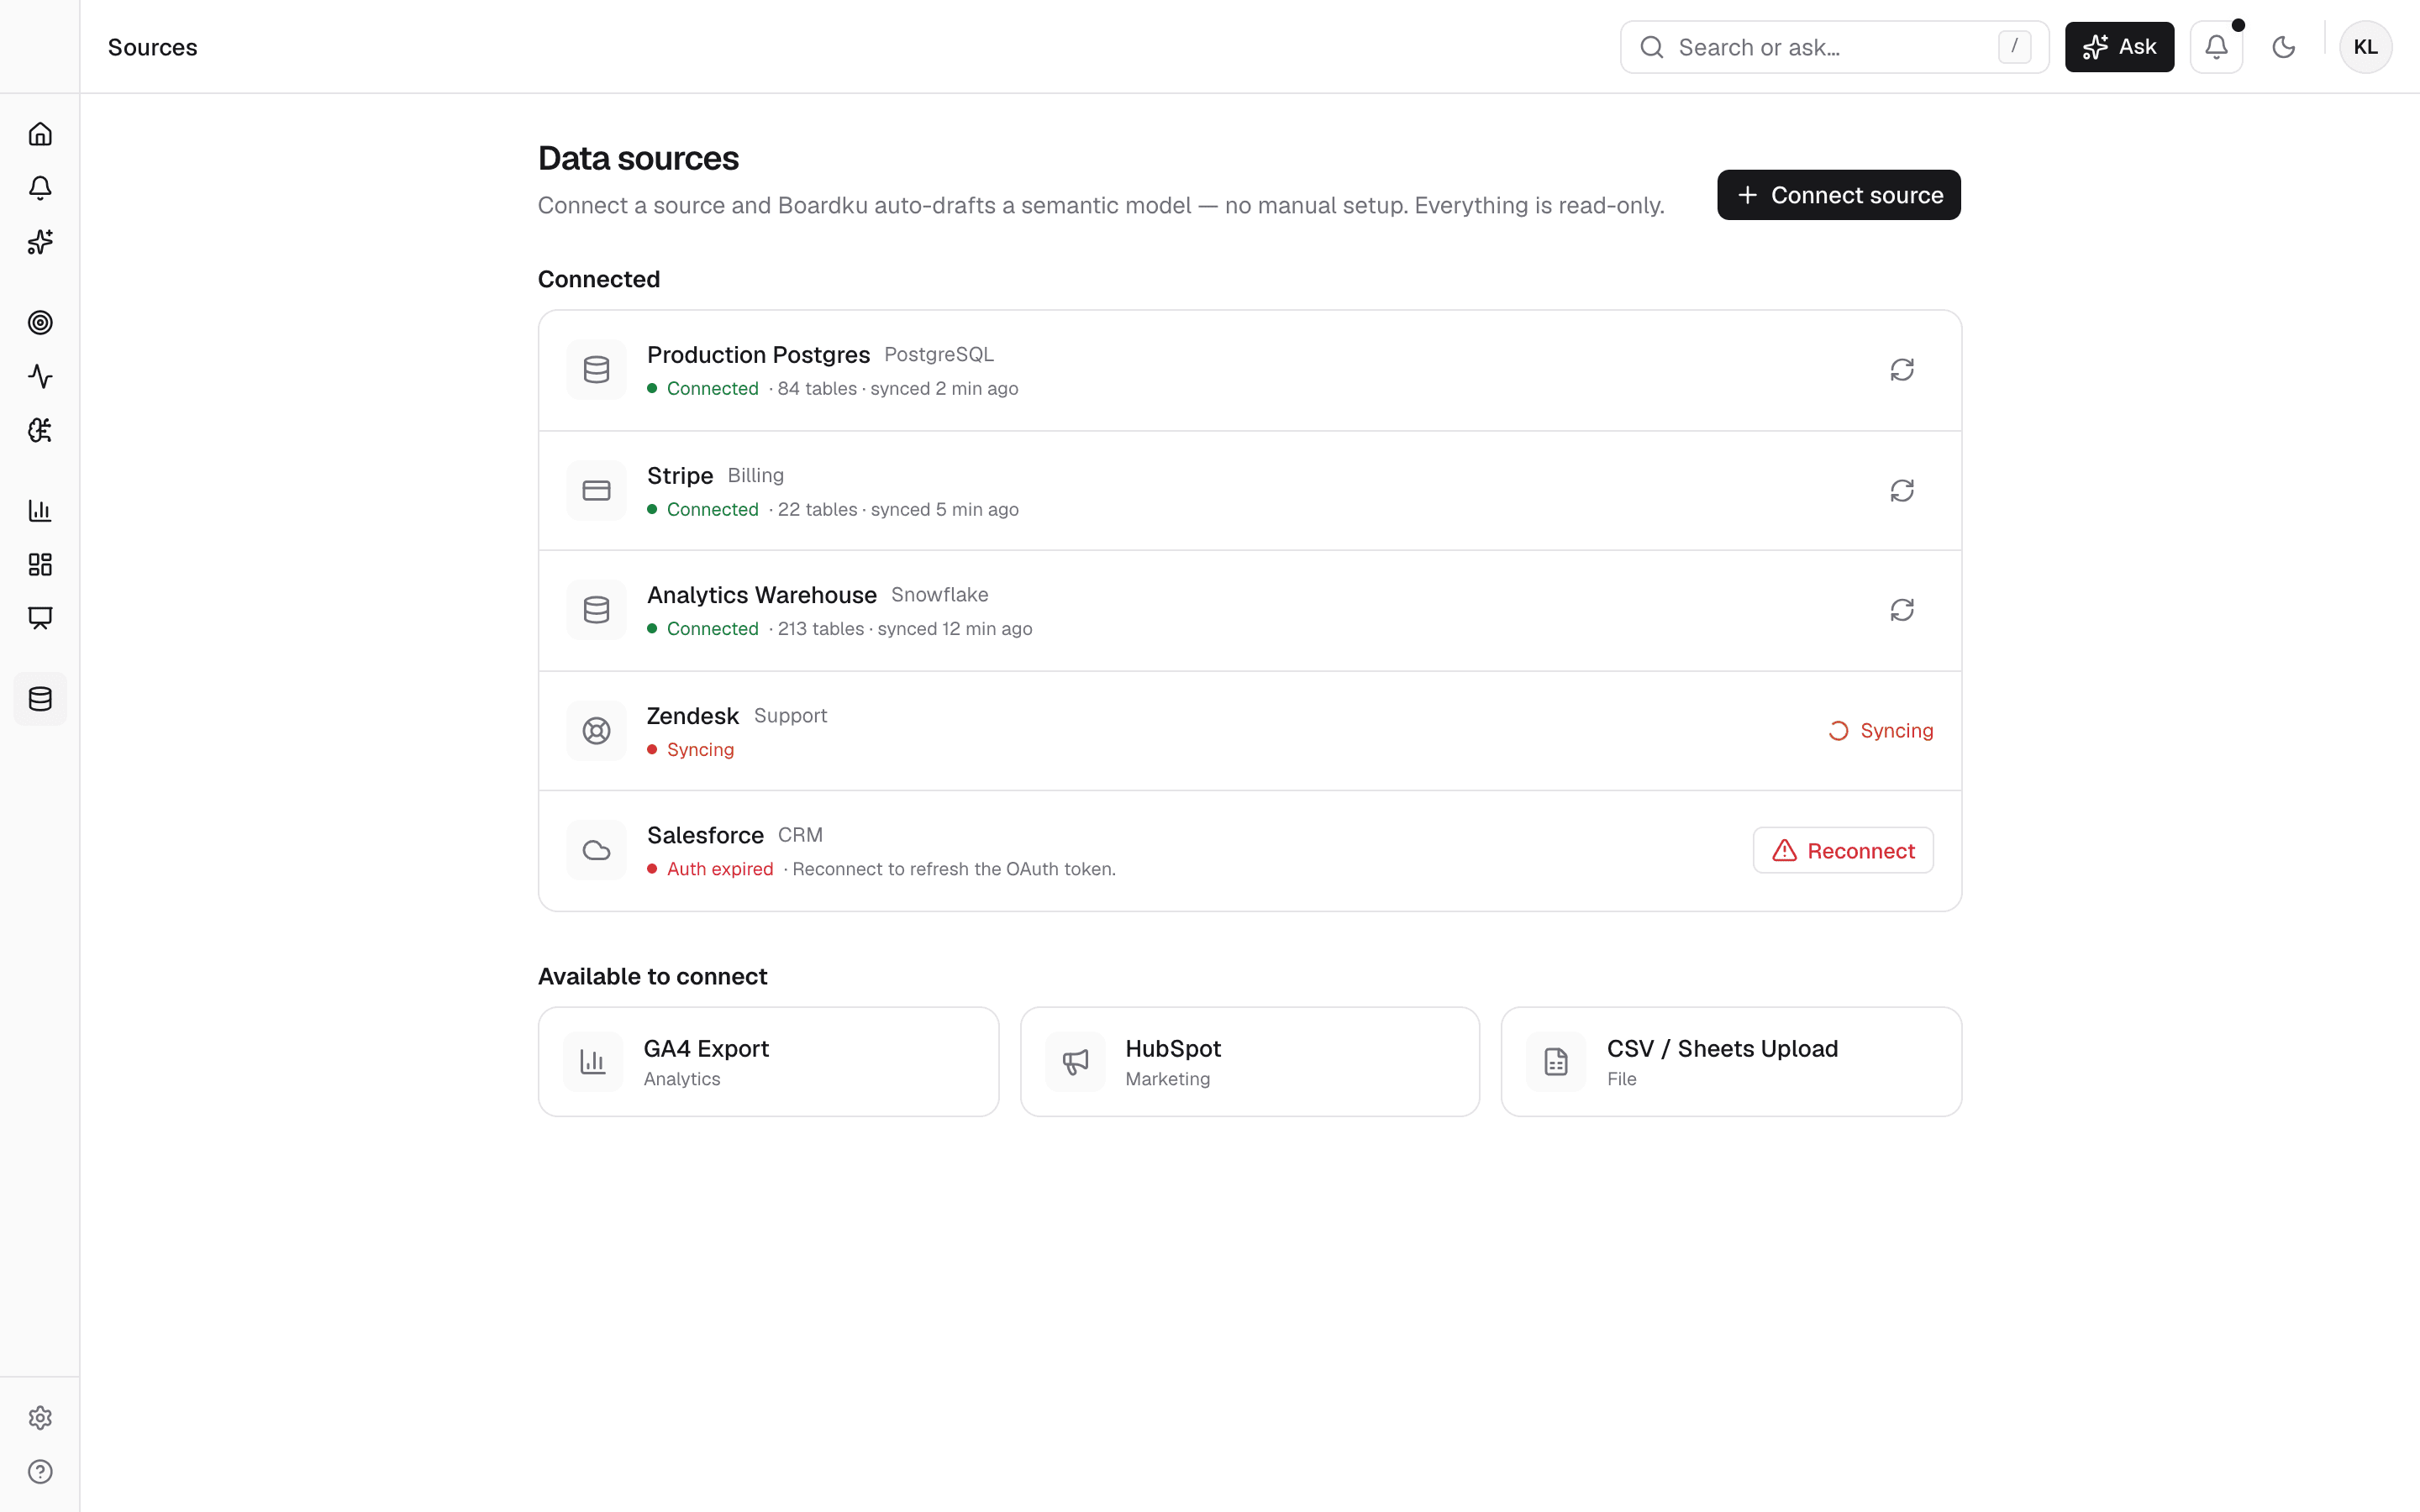
It catches the problem the moment it starts.
Set a threshold once. Boardku investigates the instant it trips, finds the root cause, and routes the finding to Slack or email.
- Always-on anomaly detection
- Multi-step root-cause, not just an alert
- Delivered where your team already works
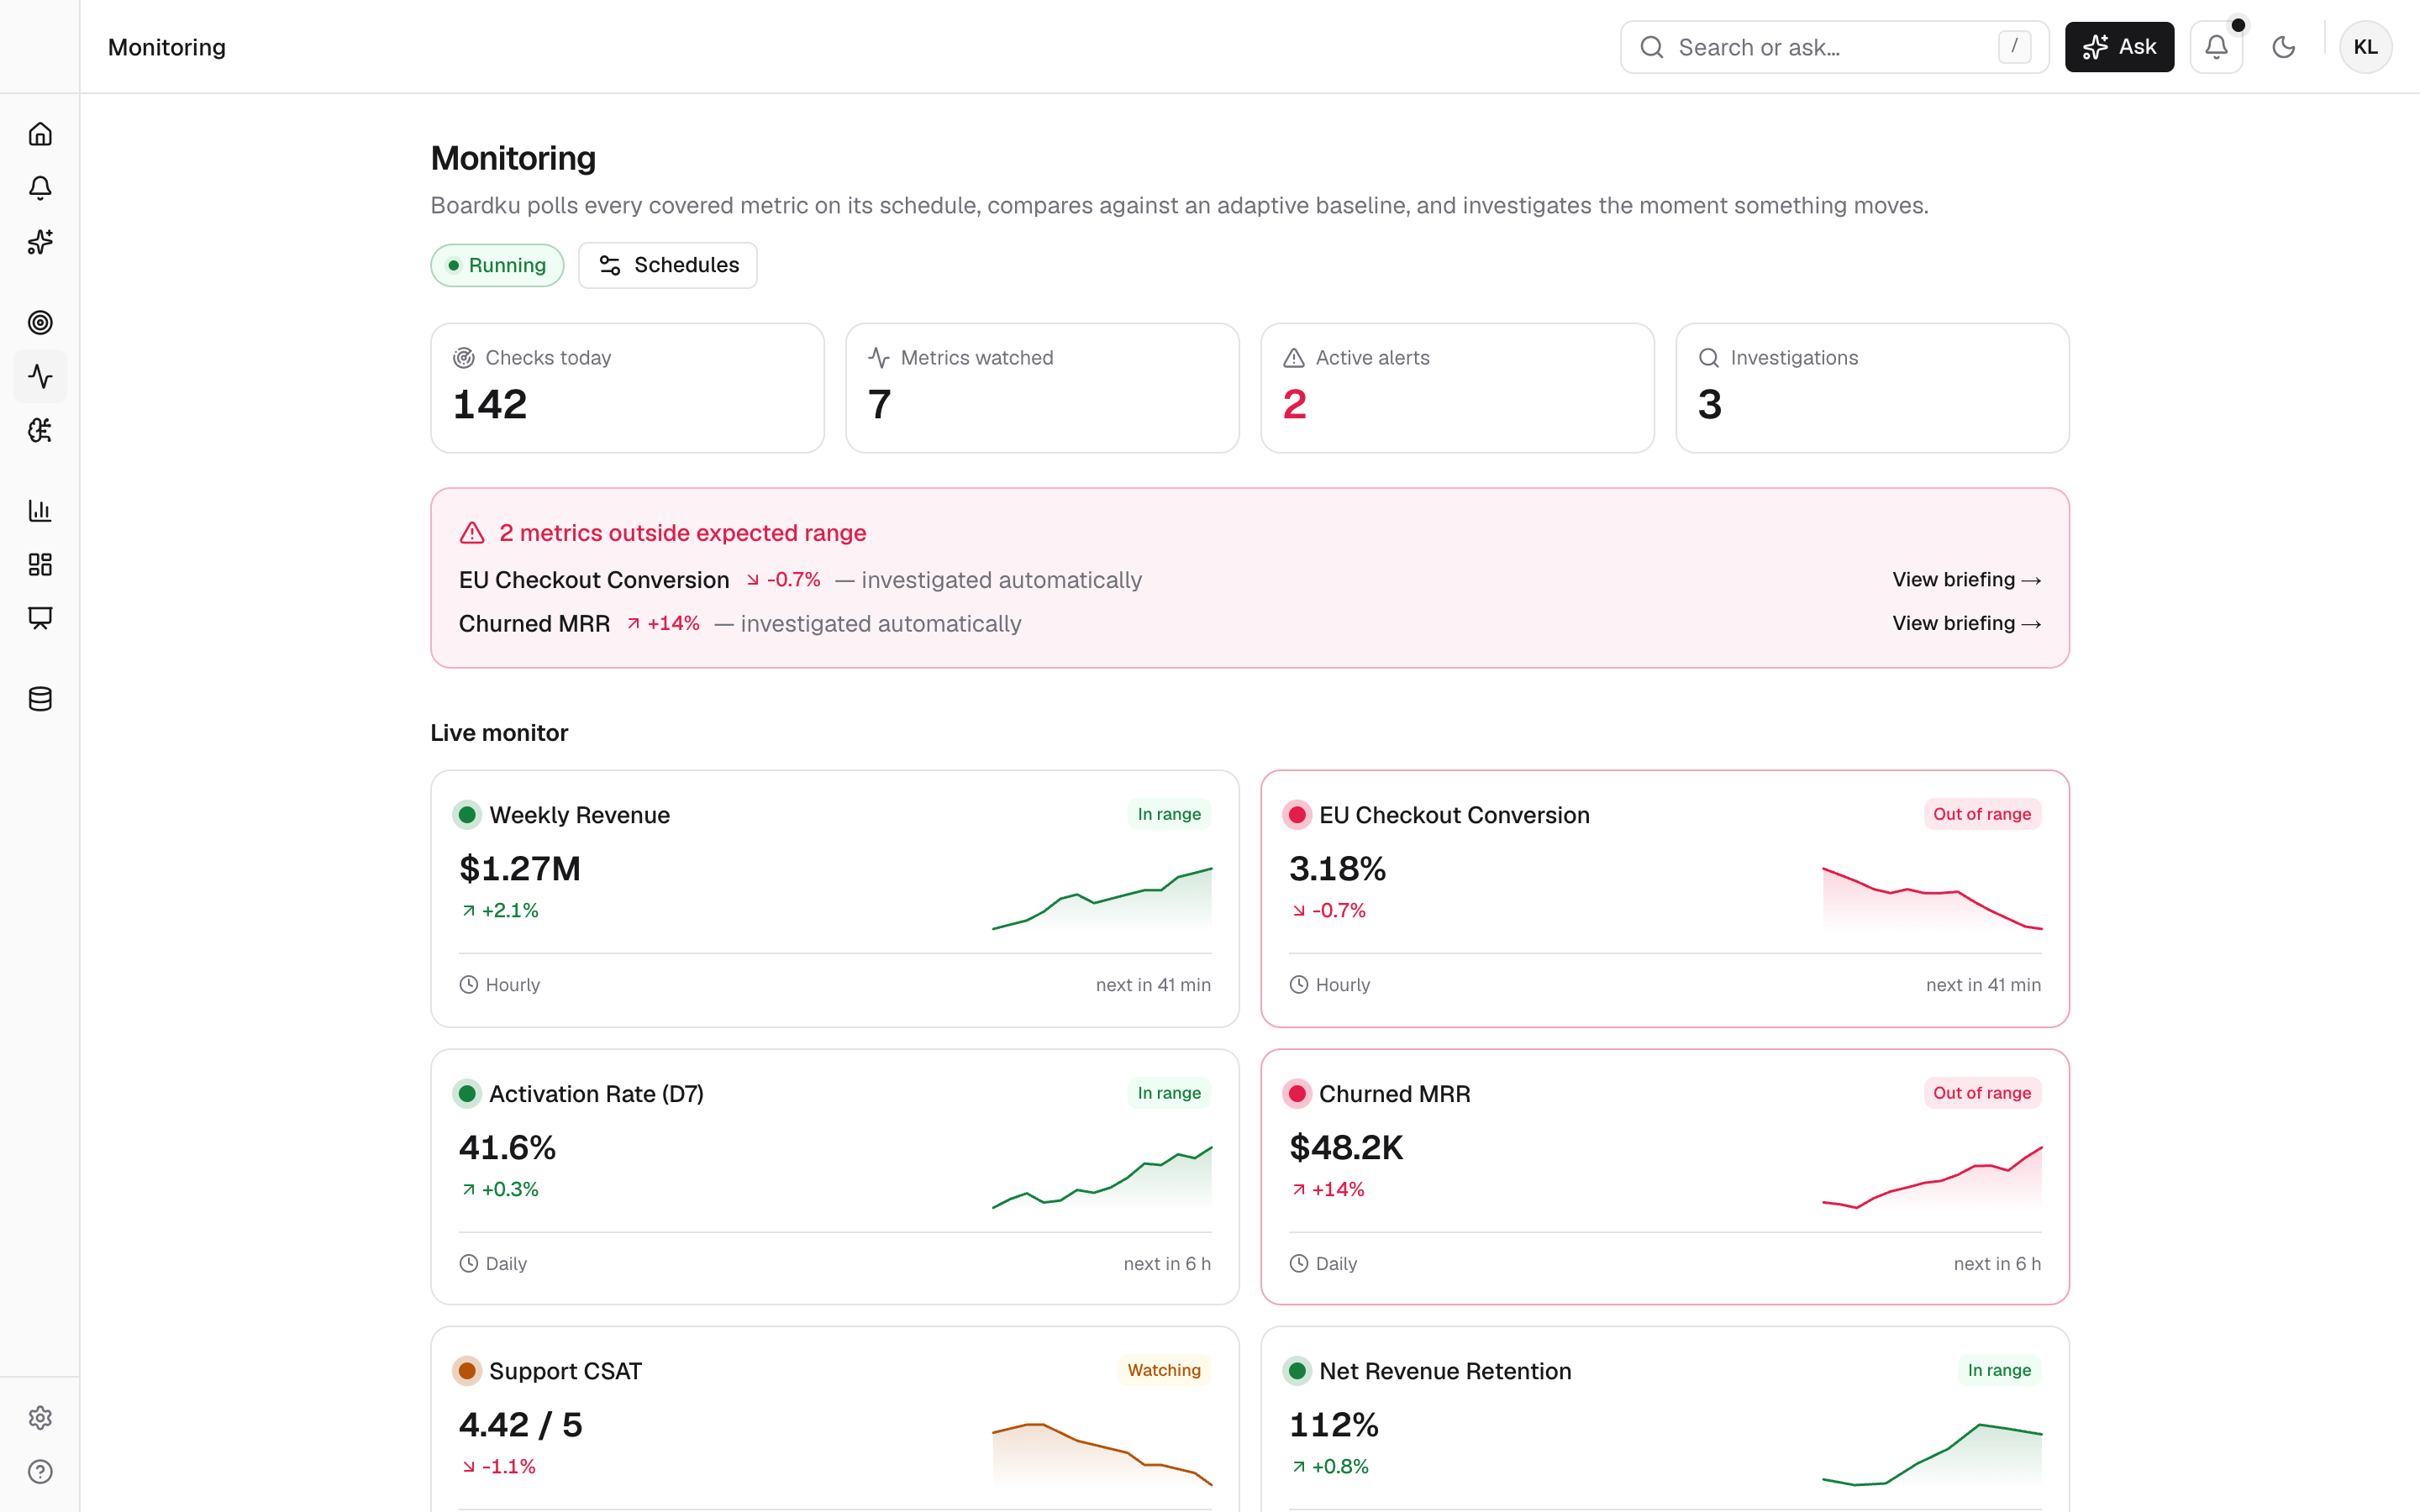
The whole analyst loop, running on its own
The four-step loop a real analyst runs — handled end to end, on its own.
Hand Boardku the metrics that matter. It owns them — a standing brief, not a one-off question.
It watches your metrics around the clock. The anomaly raises its own hand.
When a number moves, it digs until it has the cause — not just the number.
One ranked brief of what changed and why — in Slack or your inbox, SQL included.
The questions operators keep asking, ready as workflows
Common analysis loops Boardku is shaped around: revenue movement, conversion drops, metric coverage, and explainable reports.
Churn root cause
Track churned MRR, segment the movement, and keep the SQL-backed explanation with the briefing.
Revenue review
Open Monday with the metrics, drivers, charts, and caveats already gathered.
Checkout drop
Watch conversion by region, device, and step so dips are investigated before the meeting.
SQL trust
Review generated SQL, assumptions, provenance, and confidence before sharing an answer.
Metric coverage
Define the metrics that matter, then let the workspace surface what needs attention.
Board-ready reports
Save answers into reports and decks without separating the chart from the reasoning behind it.
Hand Boardku a metric. See what it finds by morning.
Connect a data source in minutes and let your always-on analyst take the first shift. No credit card required.
BOARDKU